Loyalty Rewards App
Fuel Up. Wash Up.
Get Rewarded.
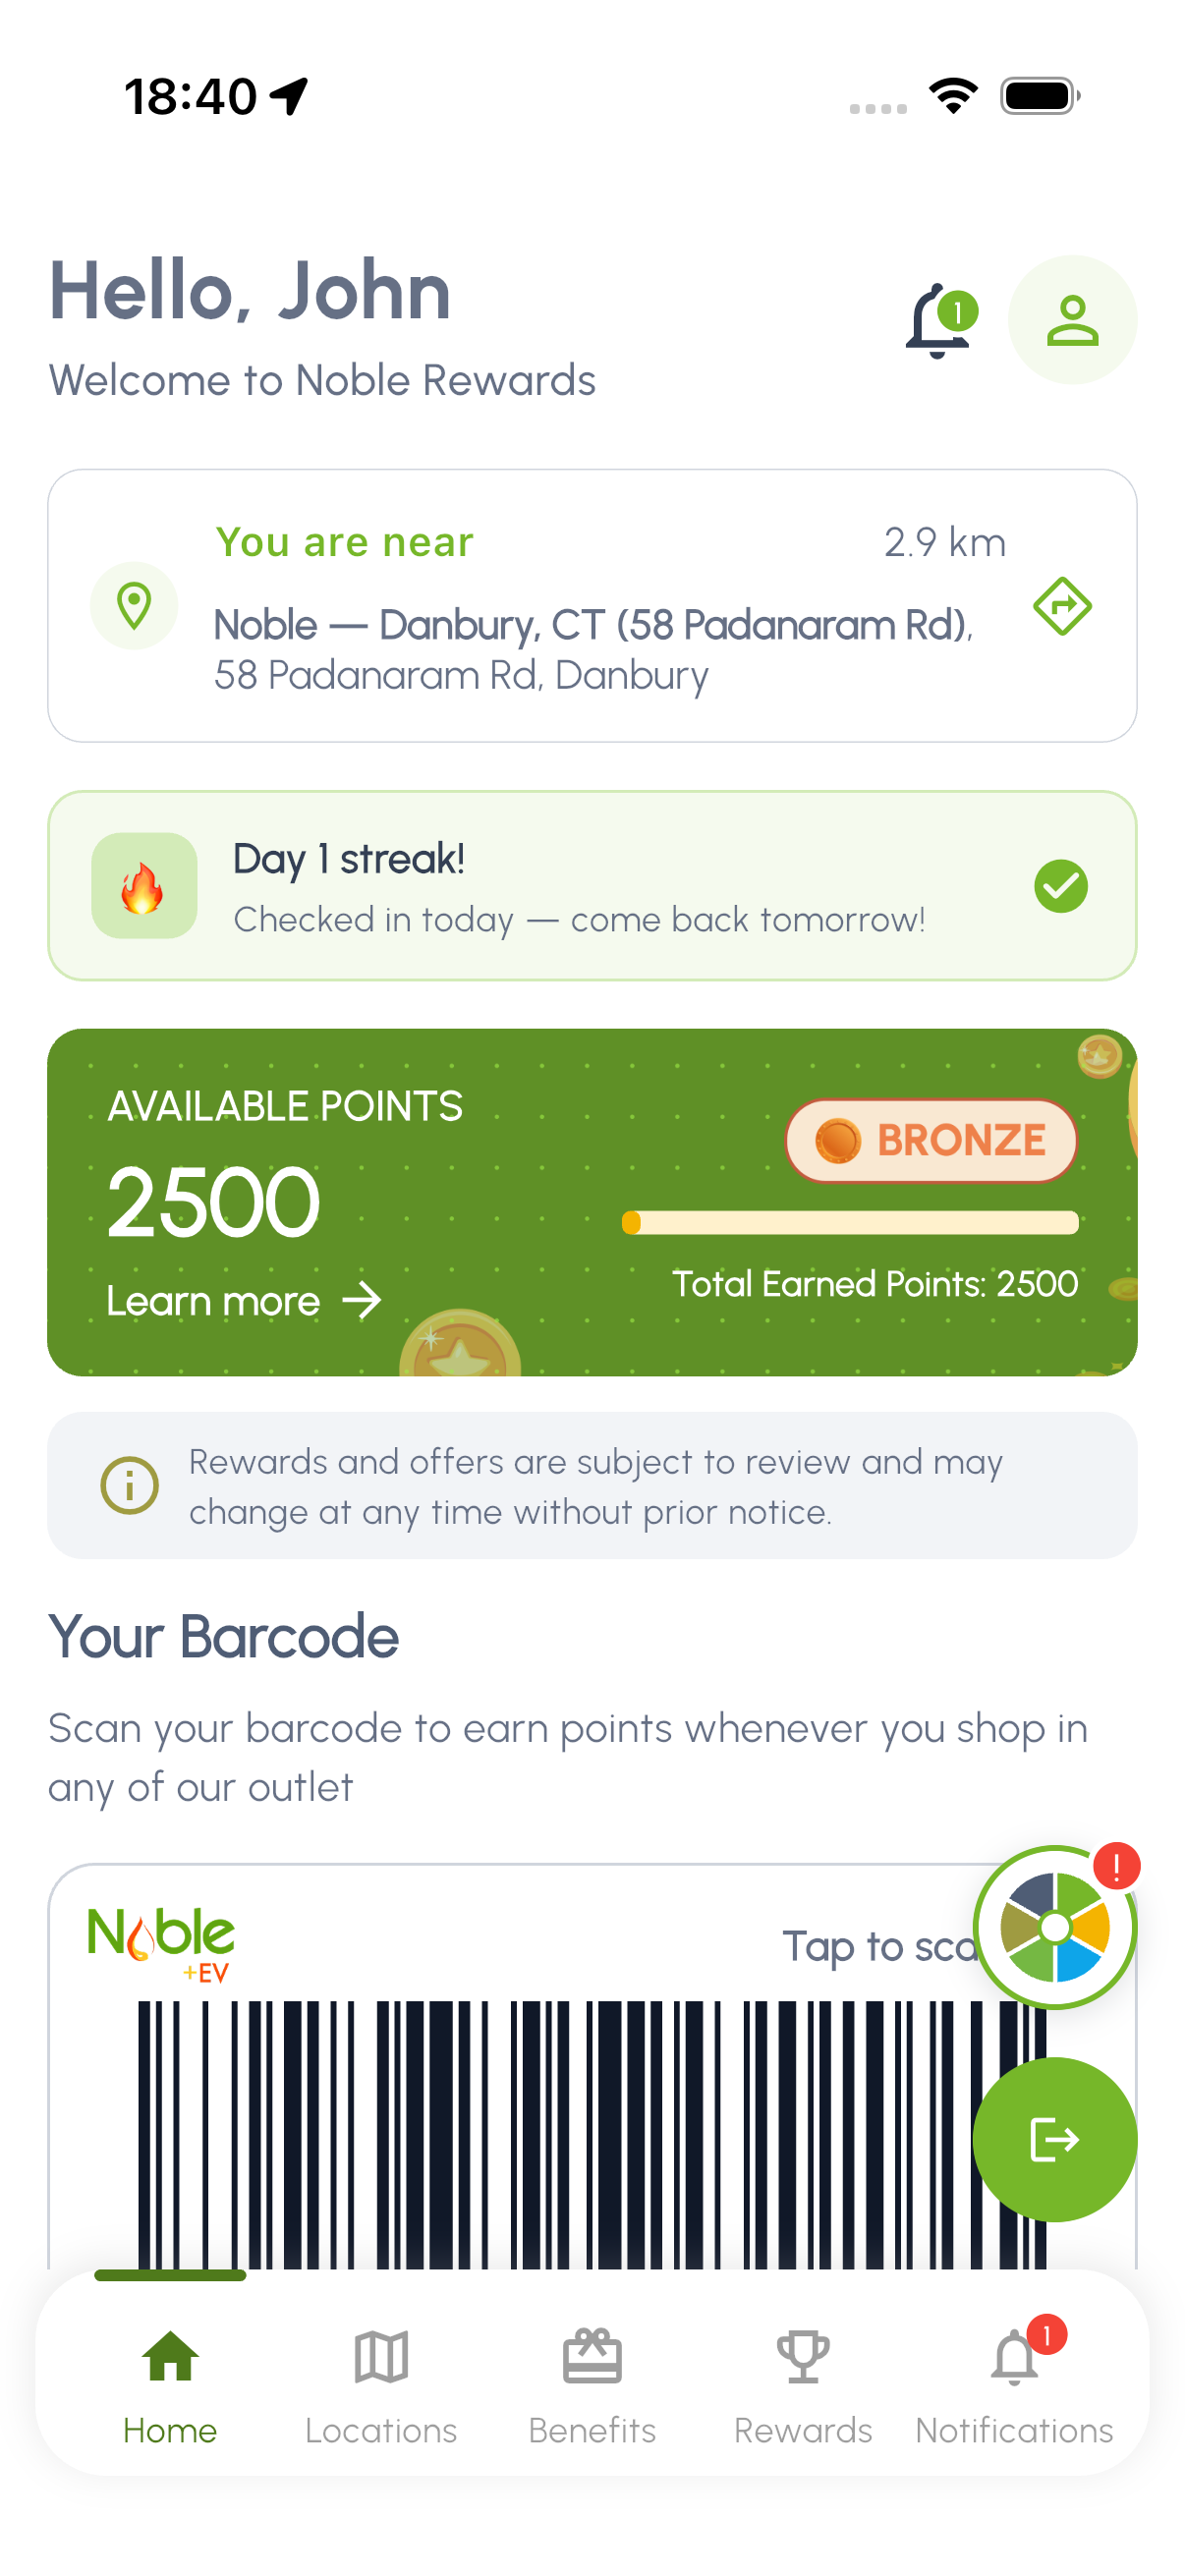
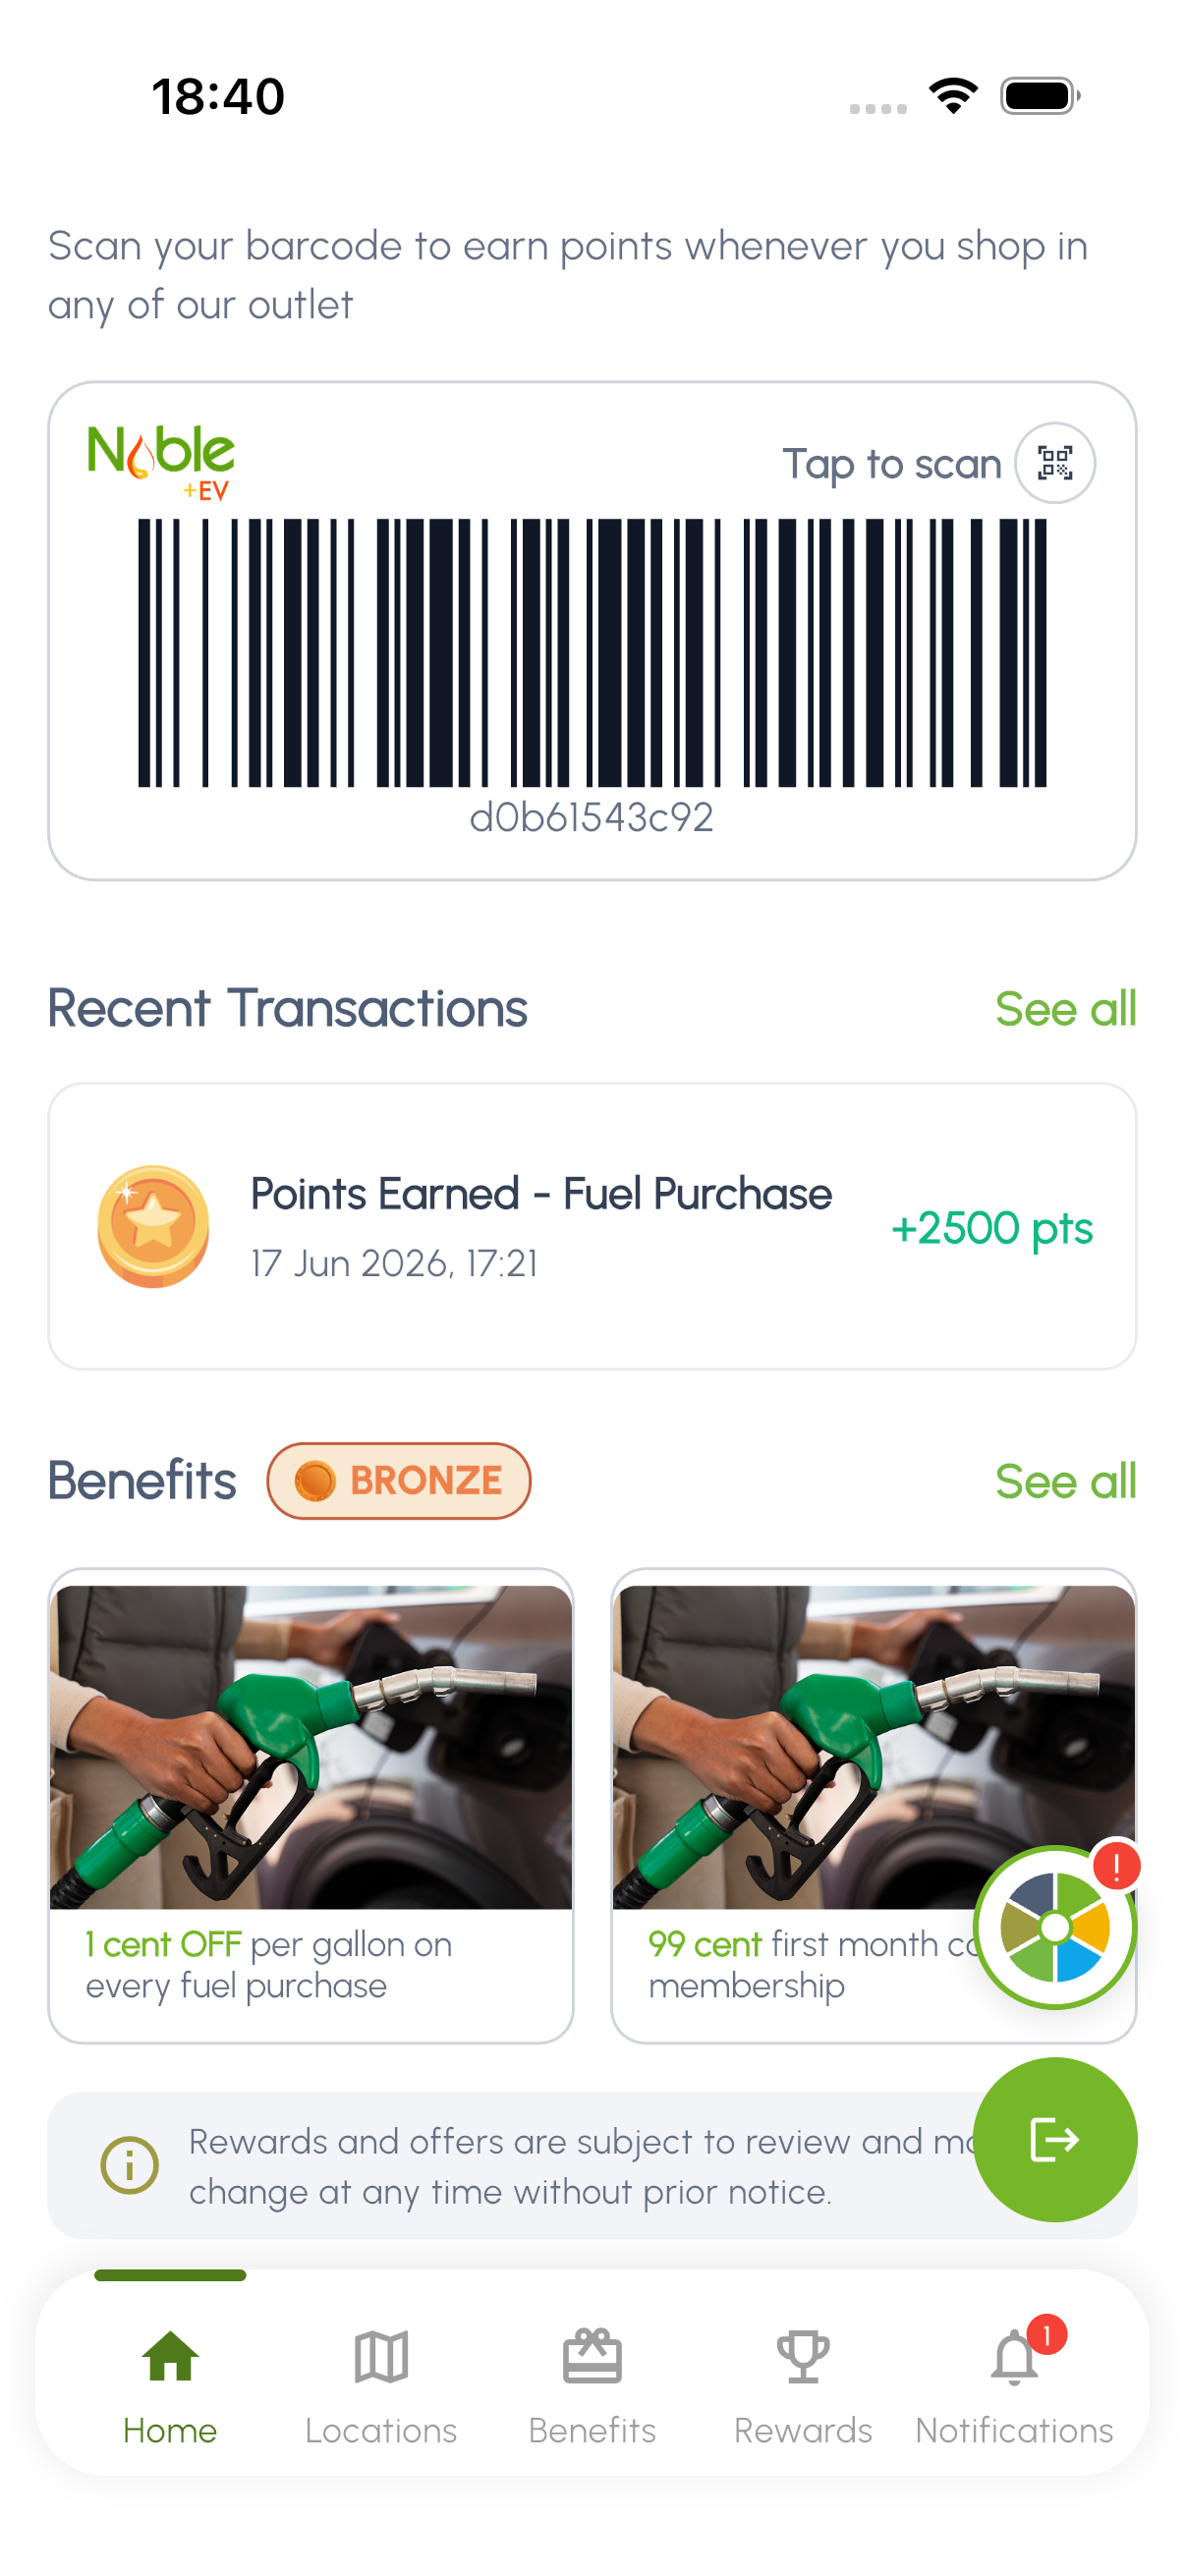
Noble Gas rewards you every time you visit. Earn points on fuel and car washes, unlock exclusive benefits, and track your rewards — all from one simple app.
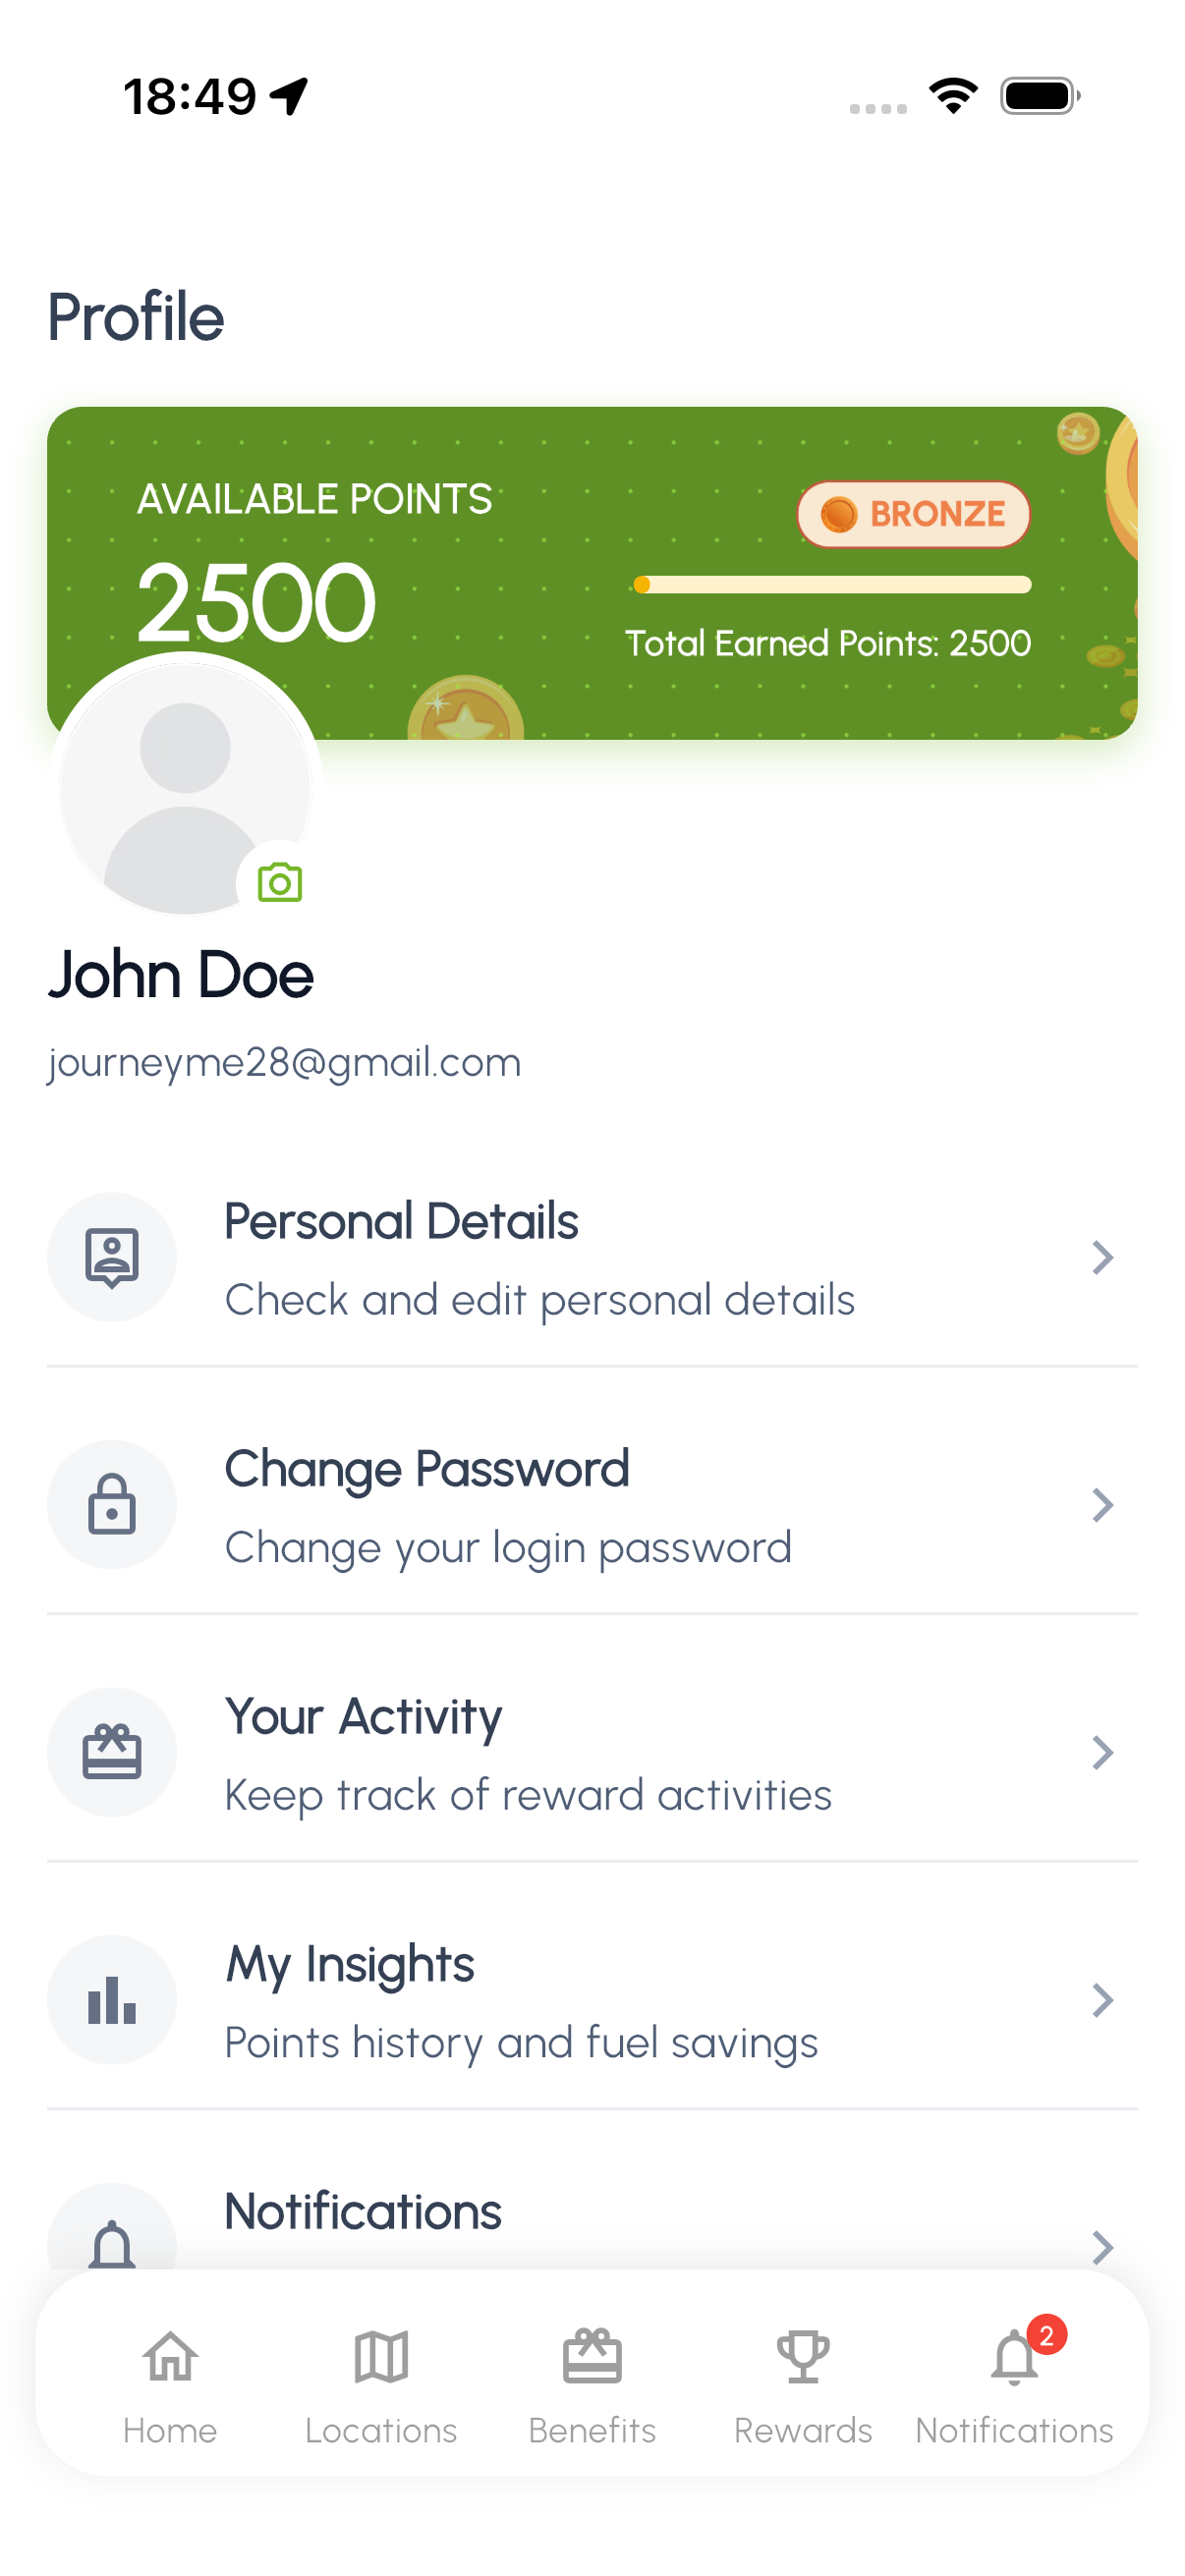
3 Tiers
Bronze, Silver, Gold
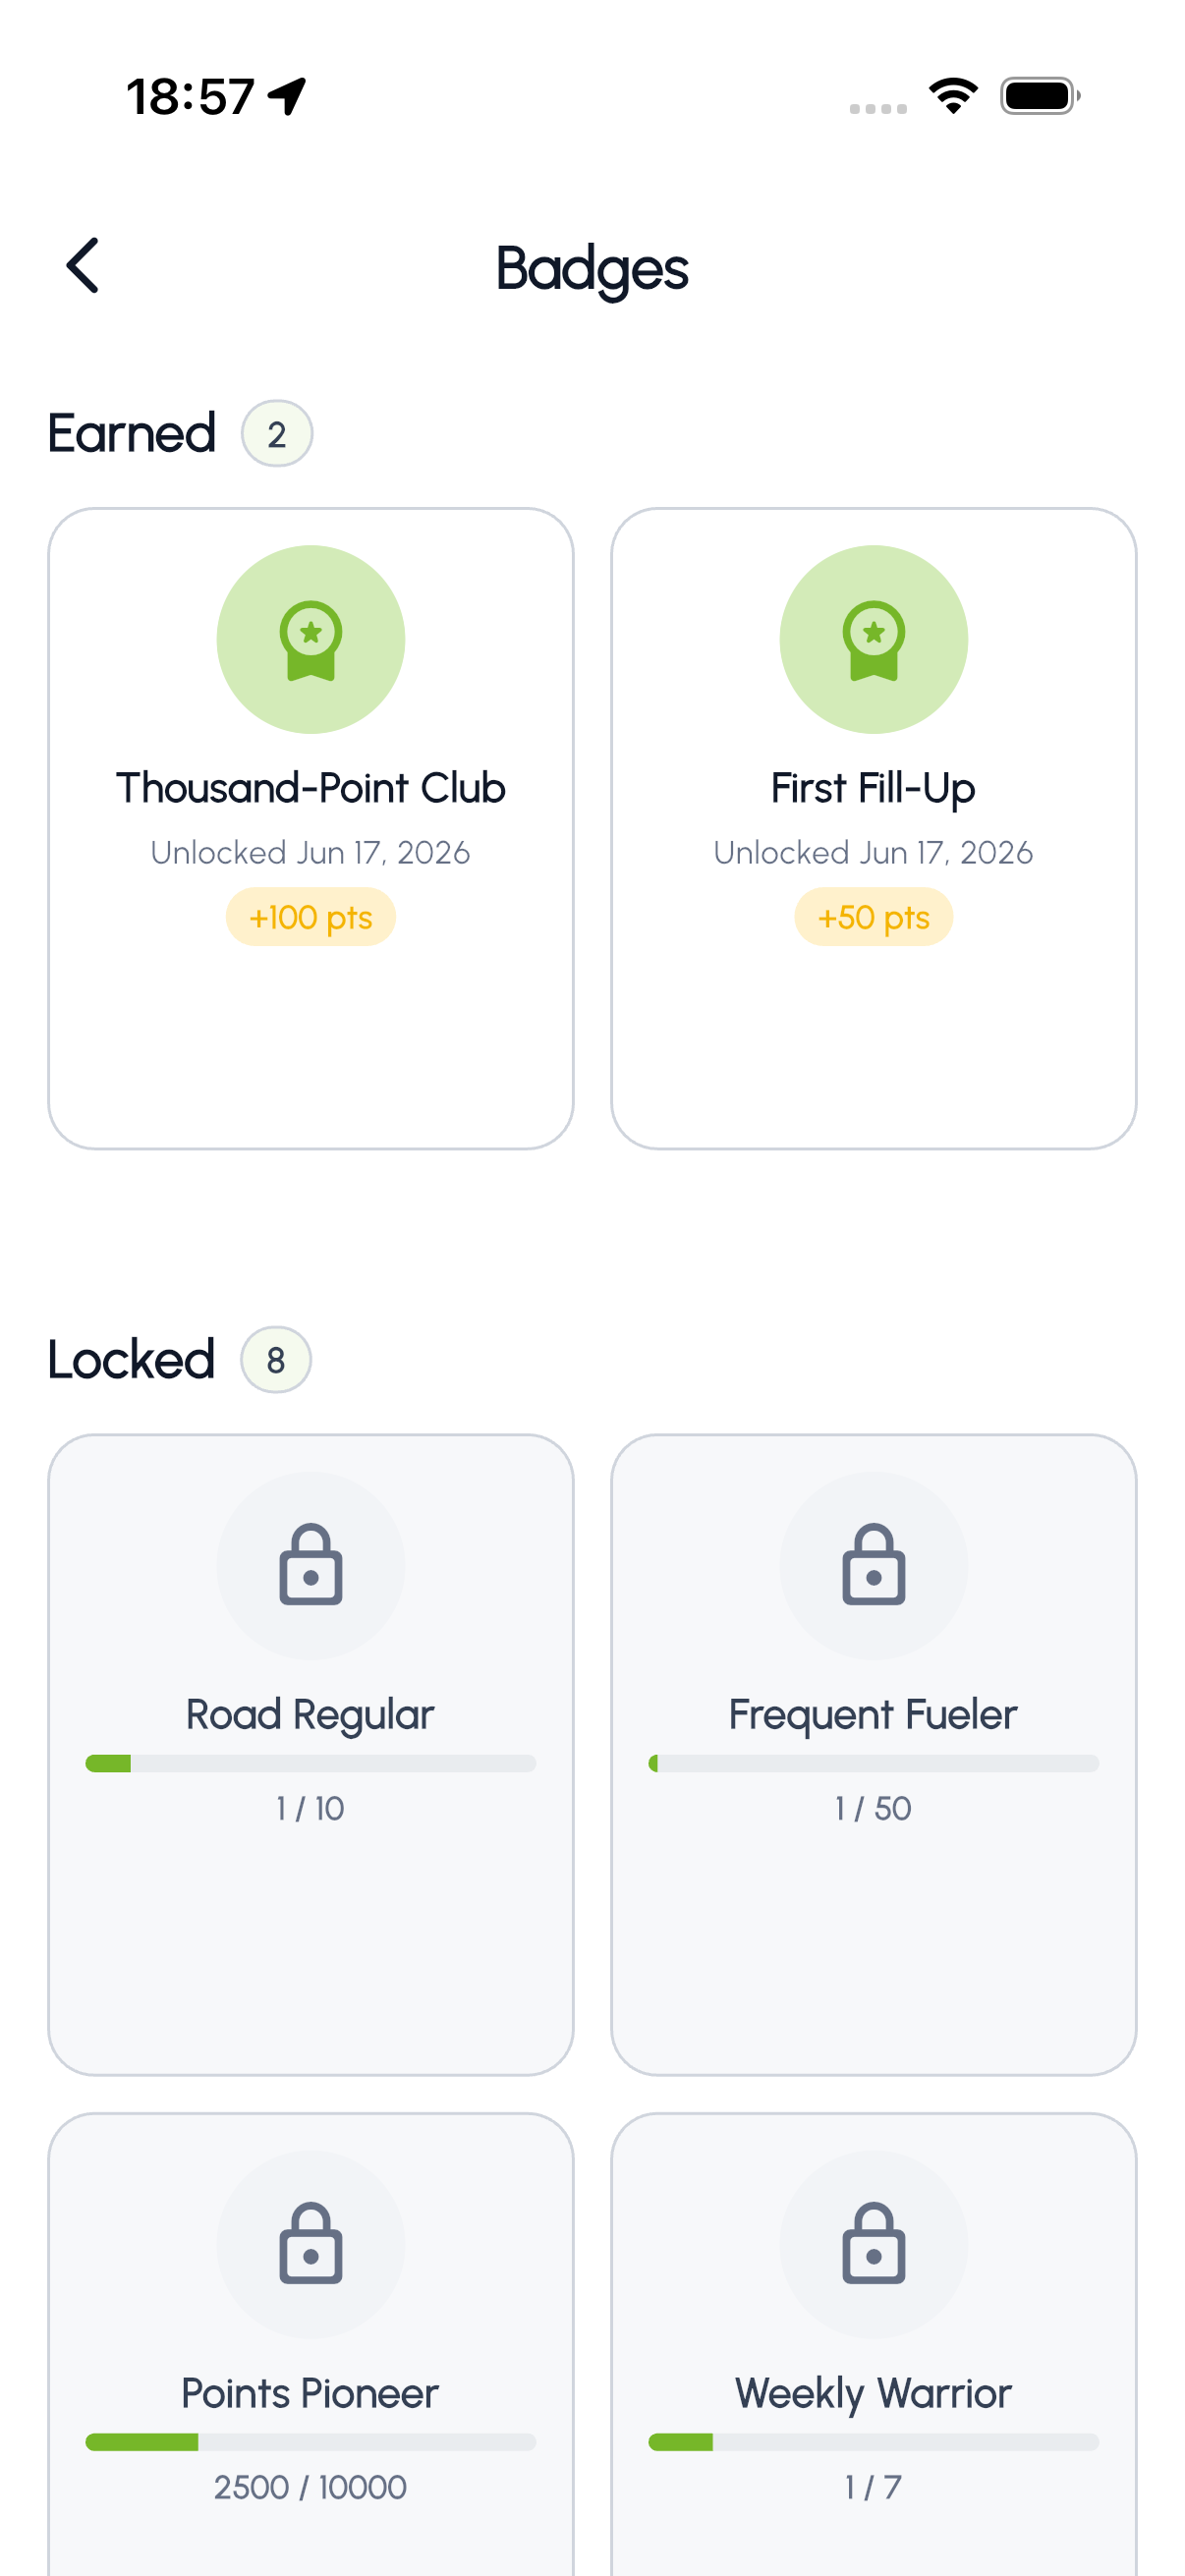
5+ Badges
To unlock
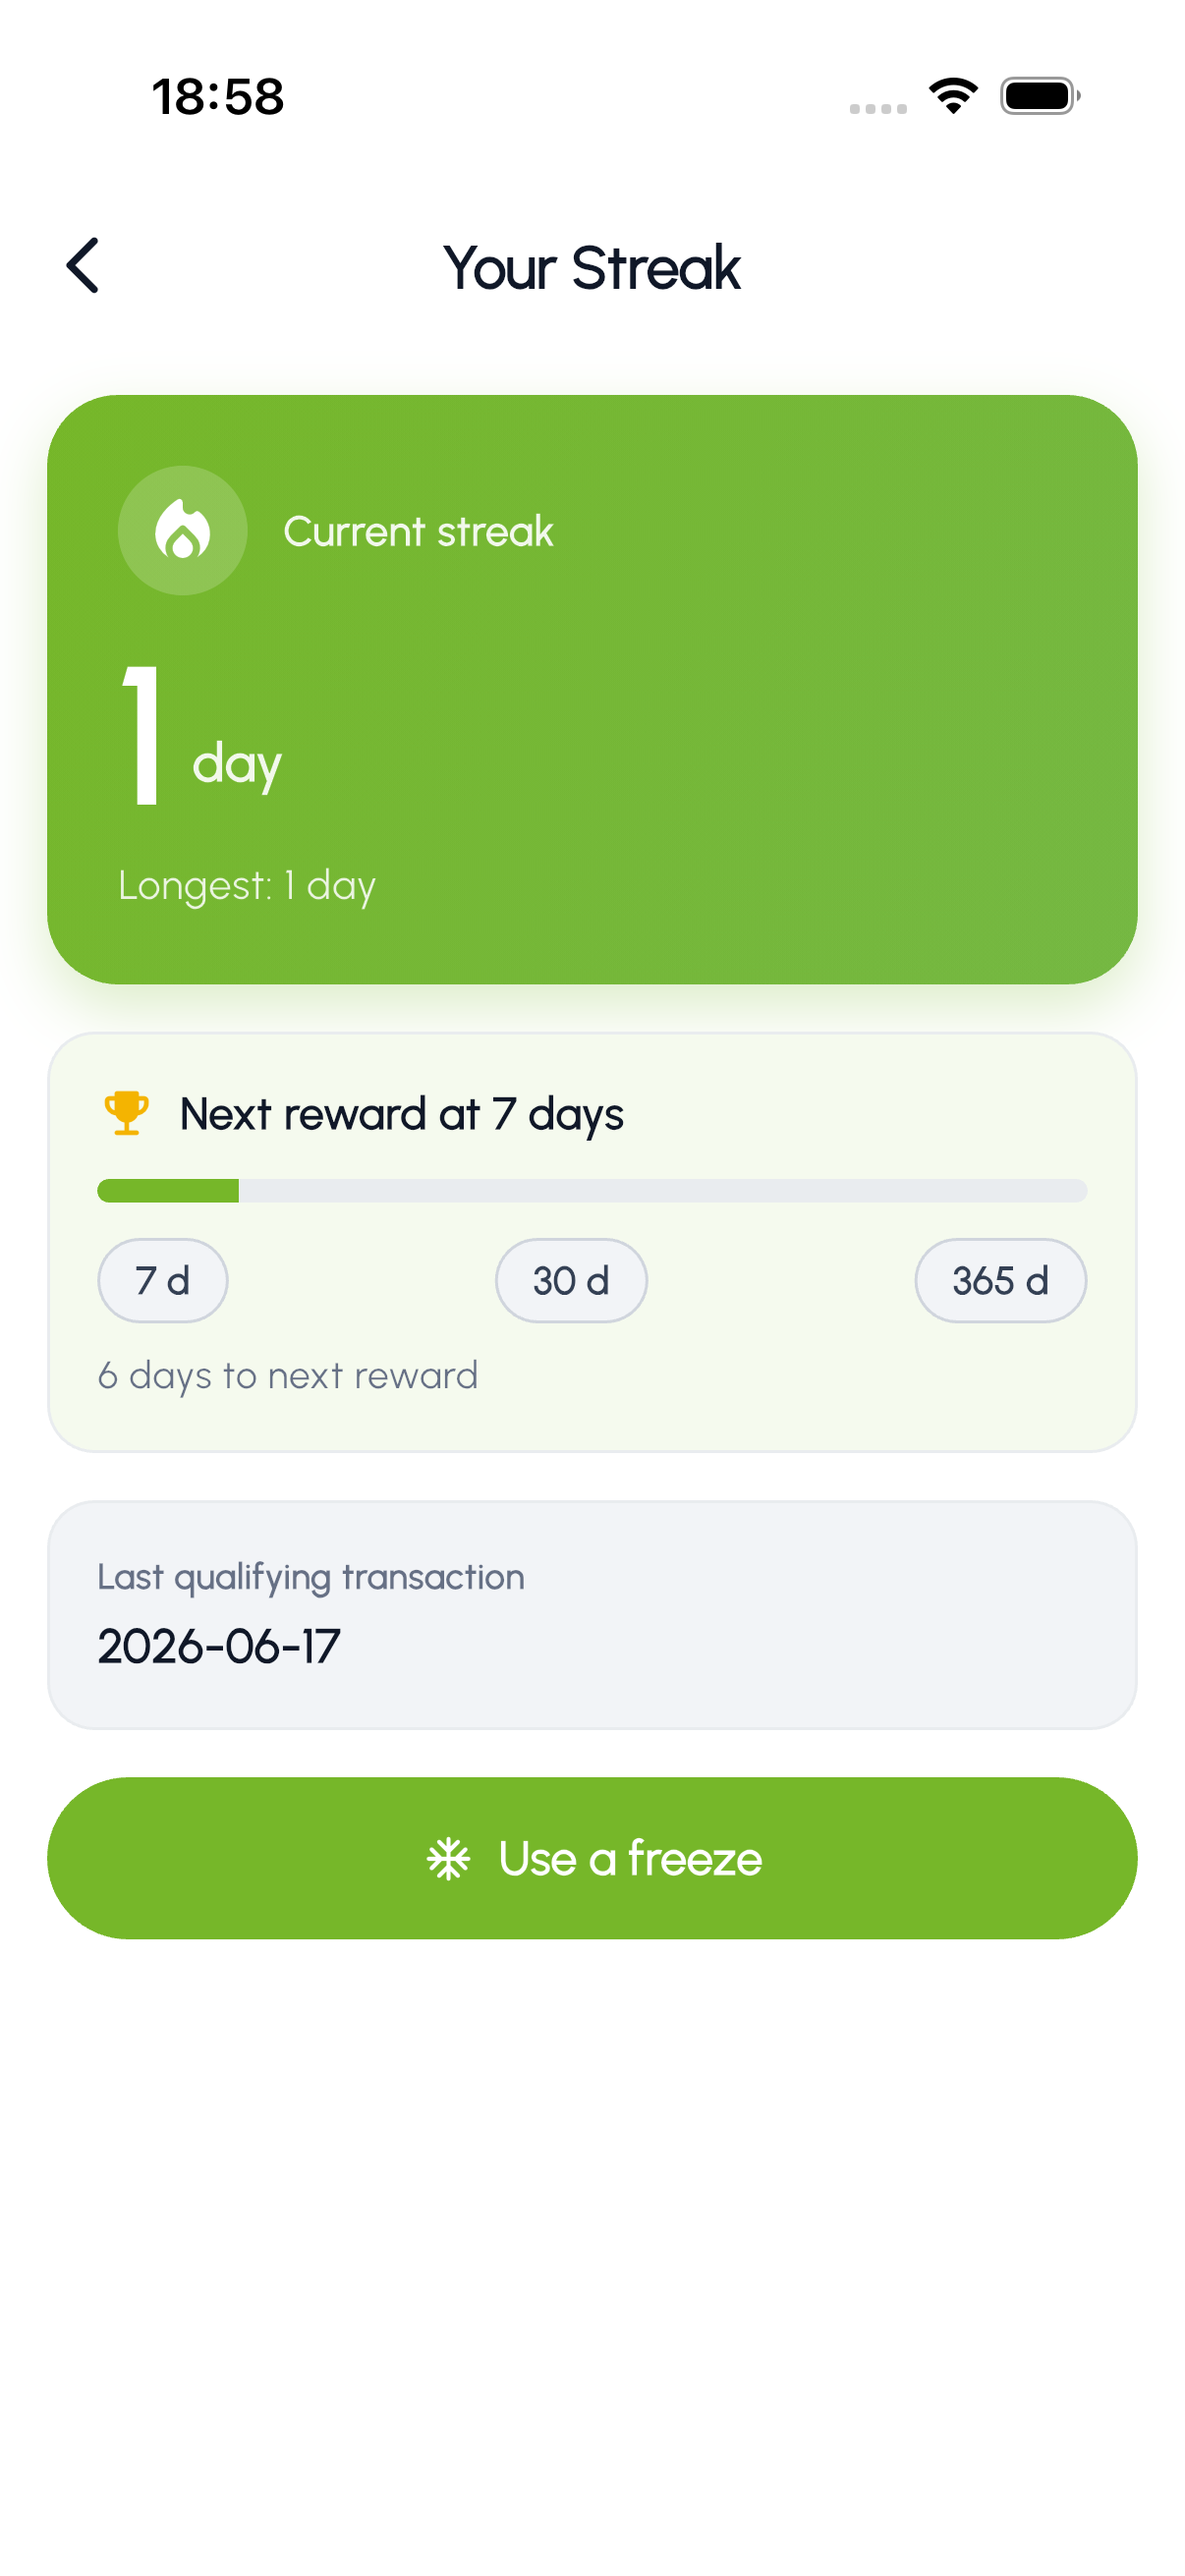
Daily
Check-in streaks